What is Your Burn?
AKA How to Read a Cash Flow Statement
What's your burn? Is one of the most universal questions investors ask, yet despite the commonality there is not a 100% uniform definition. Do they want cash flow from operations? Change in cash? Net income? Change in cash less any investment received? What do you tell them your burn is if you actually make money?
Different investors expect different answers which can be frustrating for those without a strong accounting background.
Fortunately anything anyone could want to see can be pulled from your cash flow statement…if you know how to read one.
The Three Statements
As most of us know, there are three financial statements: the Income Statement (aka Profit and Loss or P&L), the Balance Sheet, and the Cash Flow Statement. Most folks can get their heads around a P&L: revenue comes in, expenses go out, and you are left with profit at the bottom. There is some nuance around what goes into COGS vs OpEx, but most people understand the concept.
Where non-finance folks typically run into their first hurdle is understanding that the revenue and expenses on the P&L DO NOT translate to cash coming in and going out. This is where the Balance Sheet comes in. Every business using accrual accounting (which is required by GAAP, and every startup that wants to be VC backed should be doing this from day 1) will have a difference between their net income on the P&L and the change in cash for the same period.
This is because revenue and expenses must be recognized over the time period they are actually for. Some common examples:
That $100k upfront invoice you sent to your customer for the coming year? Only 1/12 gets recognized as revenue per month, and they may not pay you for 60 days. It starts out as accounts receivable on the balance sheet, and when the cash hits, the delta from what has been earned is going to deferred revenue on the balance sheet.
Similarly, that $30k annual insurance bill you just paid? That wasn't a $30k expense for a single month, that was for the year, 1/12 gets recognized per month and the delta goes to prepaid expenses on the balance sheet when you pay the cash for it.
Didn’t pay any of your bills for two months? Great, your cash balance isn’t going down as much but you are gaining accounts payable liabilities on the balance sheet (or at least you should if you are doing accounting correctly).
P.S. Pro Tip: the first thing we do when we get a new set of books is to run a balance sheet for the previous 3 years and trailing 12 months. If you want to know where all the accounting mistakes are buried in startup accounting, go to the balance sheet first. If you have smart investors, they will do the same thing.
While most folks understand how to read a P&L, few really understand how to read a balance sheet. The number who understand how to read a cash flow statement will be an even smaller minority. Including, unfortunately, many investors. Especially Angels.
While everything you need to know about a business is contained within the P&L and the Balance Sheet, the Cash Flow Statement serves as a way to bridge the difference between net income and change in cash. This is divided between 3 major buckets: Operating Activities, Investing Activities, and Financing Activities. (These last two often trip people up. Investing = investments the business is making, e.g. CAPEX equipment, not investments INTO the business. That’s Financing Activities).
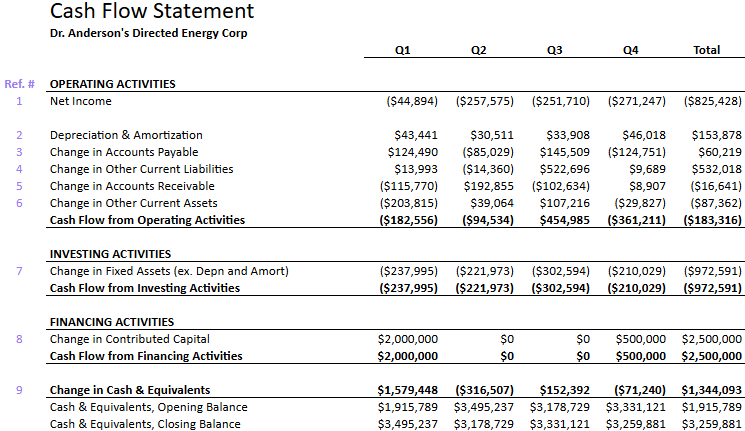
Let’s look at a simple example from Dr. Anderson’s Directed Energy Corp:
OPERATING ACTIVITIES
Net Income: We start with net income from the P&L, by the time we get to the bottom of the statement, we should see the change in cash for the period
Depreciation and Amortization: First, we add back non-cash expenses from Depreciation and Amortization. Because they are an expense on the P&L, but no cash comes out, the number is positive.
Change in Accounts Payable: Then we factor in our changes in accounts payable. If the number is positive, we’re “adding cash” because we have incurred the expense in that net income line, but haven’t paid it. If it’s negative, it means we’re reducing the balance so more cash is going out than was on the P&L for the period.
Change in Other Current Liabilities: Our Other Current Liabilities are likely deferred revenue. See the big uptick in Q3? That is likely due an invoice to a customer for work that hasn’t been completed yet, so the revenue doesn’t hit net income on the P&L, but we have received cash already, so the number is positive.
Change in Accounts Receivable: Next we factor in our changes in Accounts Receivable, i.e. what we’ve invoiced & earned, but has not been paid to us yet. This can be confusing: a negative number means we’ve added accounts receivable. Because we have revenue, but haven't gotten the cash, we are reducing the cash balance, hence, the negative.
Change in Other Current Assets: Our other current assets are usually inventory and prepaid expenses, similar to AR, an increase in those asset accounts means a negative for cash.
INVESTING ACTIVITIES
Change in Fixed Assets: As mentioned above, this can be confusing because these are things the COMPANY is “investing” in like CapEx. Because those don’t hit the P&L (they eventually will through depreciation), but cash came out, the number is negative
FINANCING ACTIVITIES
Change in Contributed Capital: Finally, we look at any investments that came into the company, AKA financing activities. We did a priced pre-seed round in Q1, and a 500k bridge SAFE in Q4. Since the cash comes in, but isn’t on the P&L the number is positive.
This gets us to a couple key numbers for the year:
Net Income= ($825,428)
Cash Flow from Operating Activities=($183,316)
Change in Cash= $1,344,093
So what is our burn?
Some investors (those who only do B2B SaaS which usually doesn’t have much CapEx) may just want to see cash flow from operating activities. We report this as “burn” for a number of our clients’ investors using their Standard Metrics requests. But the best bet of what investors want to see across all cases is your Change in Cash LESS any investment you received. We’ll do that calculation manually off of the cash flow statement. We take the change in cash of $1,344,093 and subtract the $2.5M of investment in the year and see it was ($1,155,907) or ~($96k) for the 12 month average.


